“What Got Us Here, Won’t Get Us There” – Florida’s 8th Grade NAEP Disaster
“What got you here, won’t get you there.” – Marshall Goldsmith, World-renowned business educator and coach
While Florida’s leadership celebrates 4th grade success on national assessments, they remain essentially silent when it comes to the dramatic decline in scores in 8th grade and beyond.
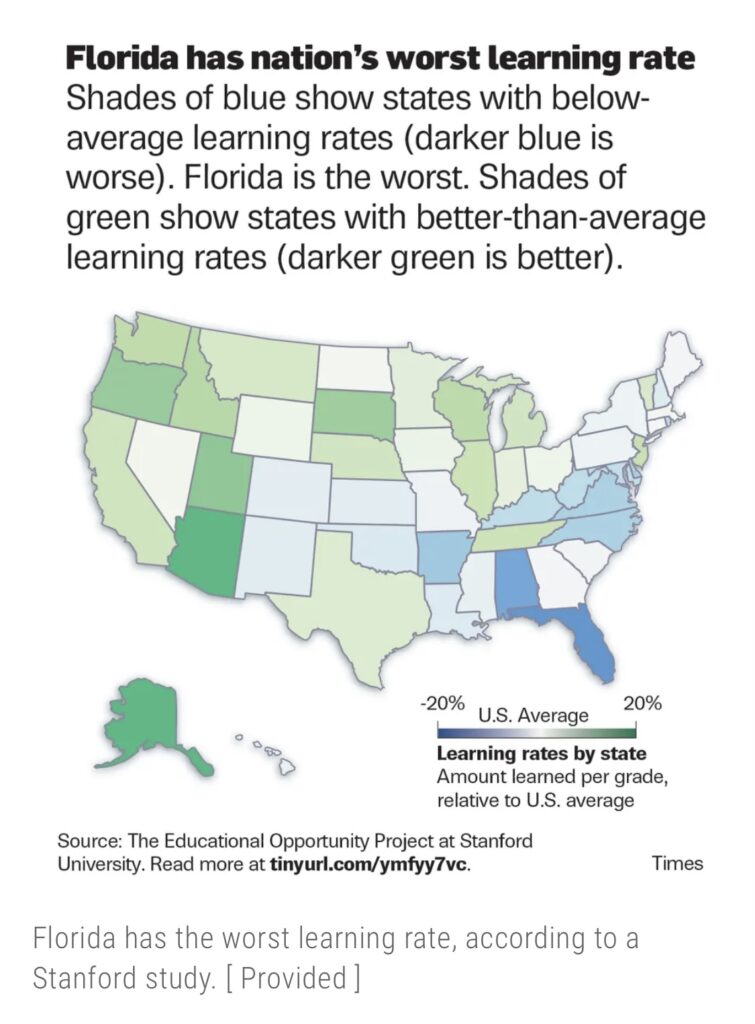
The Educational Opportunity Project at Stanford University revealed that Florida’s students learned 12 percent less each year from third to eighth grade than the national average from 2009 to 2018. The next worst state was Alabama. Florida’s response seems to be to further expand vouchers/privatization, lower requirements for teachers, increase the number of state assessments and focus on culture wars.
In a guest column in the Tampa Bay Times entitled “Florida’s education system is vastly underperforming“, Florida journalist and former Polk County School Board member, Billy Townsend reviews the Stanford study and takes a deep dive into Florida’s NAEP scores. The results are very concerning and should be read by every Floridian (Go read it now! We will wait.)
The NAEP assessment, first administered in 1990 and often referred to as the “Nation’s Report Card,” is the only common assessment that allows comparisons in various subjects across the nation, states, and in some urban districts. NAEP is given to a representative sample of students across the country attending both public and private schools. Individual student results are not reported.
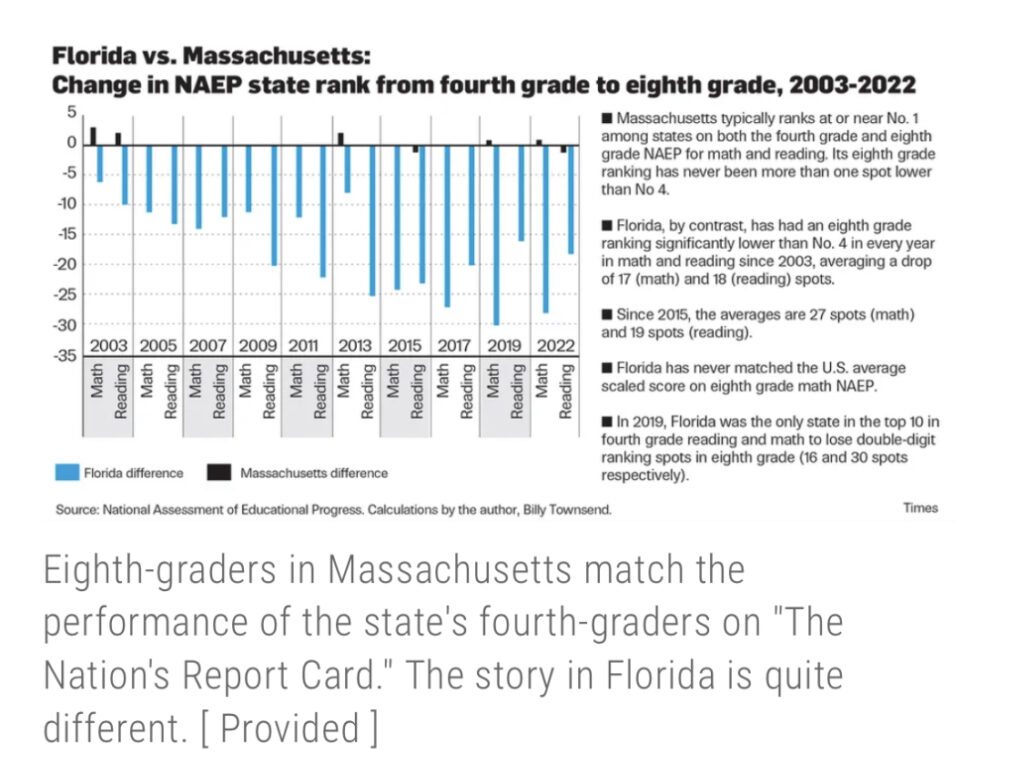
Townsend compared 4th and 8th grade NAEP results and discovered Florida’s students peak in 4th grade and then regress dramatically in 8th grade and beyond.
- The size of Florida’s regression is dramatic and growing, especially in math.
- No other state comes close to Florida’s level of consistent fourth to eighth grade performance collapse.
- Florida has never matched the U.S. average scaled score on eighth grade math NAEP.
- In COVID-marred 2022, Florida’s eighth grade scale scores in reading and math both lost 8 points relative to the national average, compared to fourth grade. That’s larger or equal to the overall collapse of NAEP scores nationwide attributed to COVID.
Read the final bullet point again.
Townsend wrote “This is a state failure, not a local one attributable to individual districts. Yet, in every NAEP cycle, Florida politicians and education leaders brag about fourth-grade NAEP results in press releases.”
Unfortunately, Townsend says, they are silent when it comes to the eighth grade NAEP results and Stanford’s “learning rate” study.
Actually, almost 6 years ago, they did briefly discuss the failings in middle school.
In 2017, the Florida Legislature instructed the FLDOE to investigate why Florida’s 8th grade NAEP scores were so terrible in comparison to its 4th grade scores (especially in math). The report highlighted the need for more support for low income families and students with disabilities and recommended efforts to decrease student mobility, which is known to have an adverse impact on student achievement. The report did not discuss the impact of per pupil funding, which was almost half that in the high performing states. The impact of choice and its destabilizing effect on student populations and schools was not considered.
The report was delivered to state leadership in December 2017. Then… crickets.
Neither of the Middle School Study sponsors, or any other legislators as far as I can tell, filed follow-up legislation to enact the report’s recommendations. There appears to be little to action taken on the results of this $50,000 study.
This post will take a closer look at Florida’s 2017 Middle School Study.
In 2017, the Monroe County School Board called for an investigation of the 127 students who had failed to graduate that year. Monroe is Florida’s southernmost county (famous for sport fishing, scuba diving and Margaritaville). In 2017, Monroe was a a “B’ rated district and had about 8,000 students in 10 traditional public schools and 6 charter schools. The school board made it a priority to reduce the barriers and provide the support students needed to successfully graduate. They called the effort Project 127. (Of note, this occurred before I was elected to the Board in 2018.)
The results were presented to the Board on June 12, 2018. One of the “barriers” identified was “student mobility.”
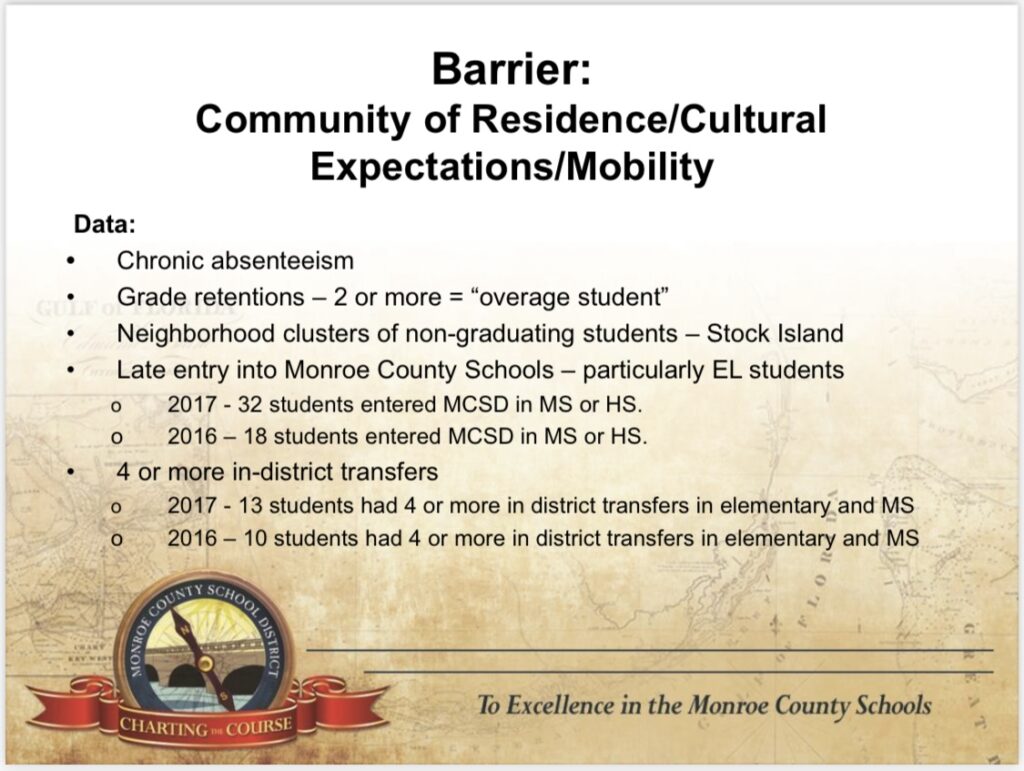
Students who had 4 or more in-district transfers in elementary and middle school were less likely to graduate high school. Monroe recognized that constant “school shopping” was not good for its most at-risk students. (Of note, 2 or more grade retentions were also a red flag, and Monroe also changed its retention policies, providing more interventions and fewer retentions)
At almost the same time, during Florida’s 2017 Legislative Session, Senator Kelli Stargel and Representative Colleen Burton proposed SB360 and HB293, respectively. The bills called for a “Middle School Study,” requiring the FLDOE to “issue a competitive bid for a private vendor to conduct a comprehensive study of states with high-performing students in grades 6 through 8 in reading and mathematics, based on the states’ performance on the National Assessment of Educational Progress.”
The texts of both bills began with a serious of “WHEREASs” demonstrating that legislators were aware of and concerned about the clear decline between 4th and 8th grade NAEP scores:
“WHEREAS, since 1998, Florida has seen a continuing trend of reading improvement in the elementary school grades, which has led to an increase of 17 percentage points in reading at or above proficiency for 4th grade students on the National Assessment of Educational Progress, while Florida’s 8th grade students achieved only an increase of 7 percentage points, and
WHEREAS, since 2003, Florida’s 4th grade students have demonstrated an increase of 11 percentage points in mathematics at or above proficiency on the national assessment, while Florida’s 8th grade students have shown an increase of only 3 percentage points, and
WHEREAS, since 2013, Florida’s middle school students’ proficiencies on the national assessment in both reading and mathematics have remained flat or decreased, and
WHEREAS, Massachusetts, New Hampshire, Vermont, Connecticut, and New Jersey are the top performing states in the percentage of 4th and 8th grade students scoring at or above proficiency in reading on the national assessment, and
WHEREAS, Massachusetts, Minnesota, New Hampshire, New Jersey, and Washington are the top performing states in the percentage of 4th and 8th grade students scoring at or above proficiency in mathematics on the national assessment, and
WHEREAS, Florida’s academic expectations for students in both reading and mathematics were raised in 2010 and 2014, and
WHEREAS, the performance of Florida’s middle school students on the state assessments in reading has remained flat since the state’s standards were raised, while their performance in mathematics increased slightly between 2015 and 2016, and
WHEREAS, success in the middle school grades is a predictor of academic success in high school and college and career readiness…”
The bill required the findings of the study and the recommendations to improve middle school study performance to be reported to the Governor (then Rick Scott), the State Board of Education, the President of the Senate (then Joe Negron), and the Speaker of the House of Representatives (who was our recent Commissioner of Education, Richard Corcoran) by December 2017.
Both bills soared through committees with unanimous votes, few questions, no debate. The bills were supported by Jeb Bush’s Foundation for Florida’s Future, the teachers union and the Florida PTA. Apparently, “everyone” wanted to know what was going on in middle school.
In case you were wondering, at the time of SB360/HB293, current Commissioner of Education, Manny Diaz Jr., was the Chair of the House PreK-12 Appropriations Subcommittee and sat on the House Education Committee; both committees heard the Middle School Studies bill.
An organization named Insight Policy Research was hired to complete the study and it was submitted, as required, on December 22, 2017. You can read the complete report here.
Here are a few interesting findings.
At Risk Populations
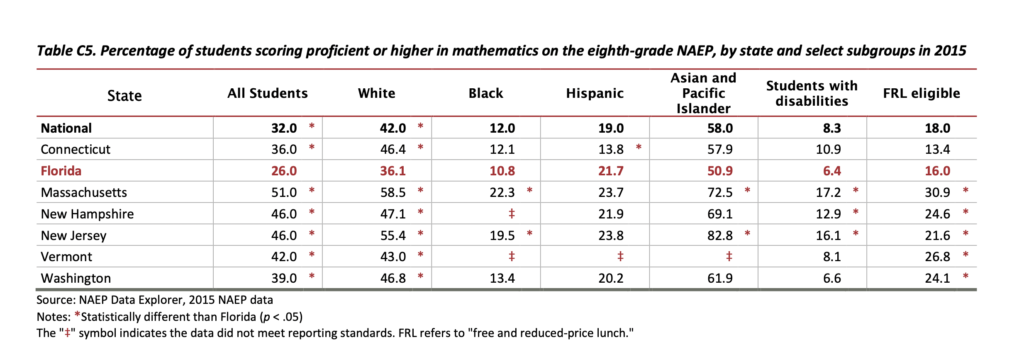
Per the report, Florida had a significantly lower median income and parents had significant lower levels of education (Tables C-3 and C-4 on pages C-2 – C3) compared to the high performing states, so it was not surprising that Florida had more students qualifying for Free or Reduced Lunch (FRL). Also, no surprise, that Florida had a larger number of English Language learners. What was, perhaps, surprising was that each subgroup significantly underperformed on the 8th grade assessments in comparison to similar student populations in the comparison states.
Florida’s population of low-income students eligible for FRL was considerably higher than that of the comparison states and those students performed worse on the NAEP mathematics assessment compared to students eligible for FRL in five comparison states
Florida has a similar percentage of students (15 percent) eligible for individual educational plans as the comparison states, but students with disabilities in Florida also performed worse on the NAEP relative to three comparison states.
The report recommended (page 17) that Florida focus on mathematics instruction and increase support for its ELL, SWD and Free and Reduced Lunch (FRL) populations.
Reduced Resources
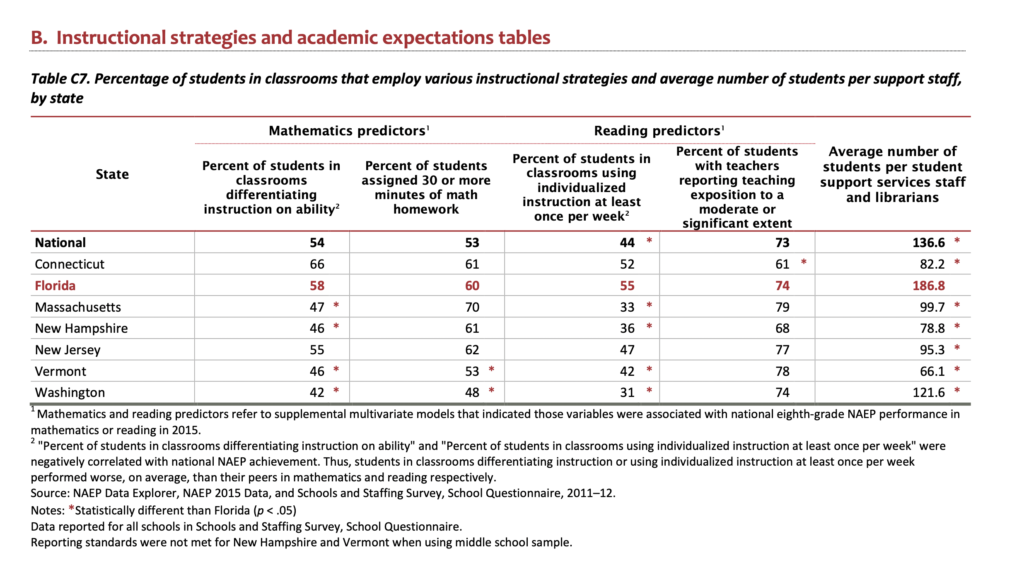
Providing increased support requires increased support staff but the report demonstrated Florida’s schools were comparatively understaffed. Although Florida’s Constitution restricts class size, there were significant differences in the average number of students per support services staff and librarians, with Florida having 2-3 TIMES more students per support staff.
The report made NO mention of education funding and did NOT compare differences in per pupil funding. In 2017, Connecticut, Massachusetts, New Hampshire, New Jersey and Vermont were in the top ten states for per pupil spending (ranging from $16K – $19K/pupil). Florida’s per pupil spending, at just over $9K, ranked 44th in the nation. This definitely could explain the lack of support staff…
Student Population Disruption
The report demonstrated that Florida had a significant problem with student mobility, which is negatively correlated with student achievement. Relative to the comparison states, Florida had a larger proportion of students in schools with high rates of student mobility.
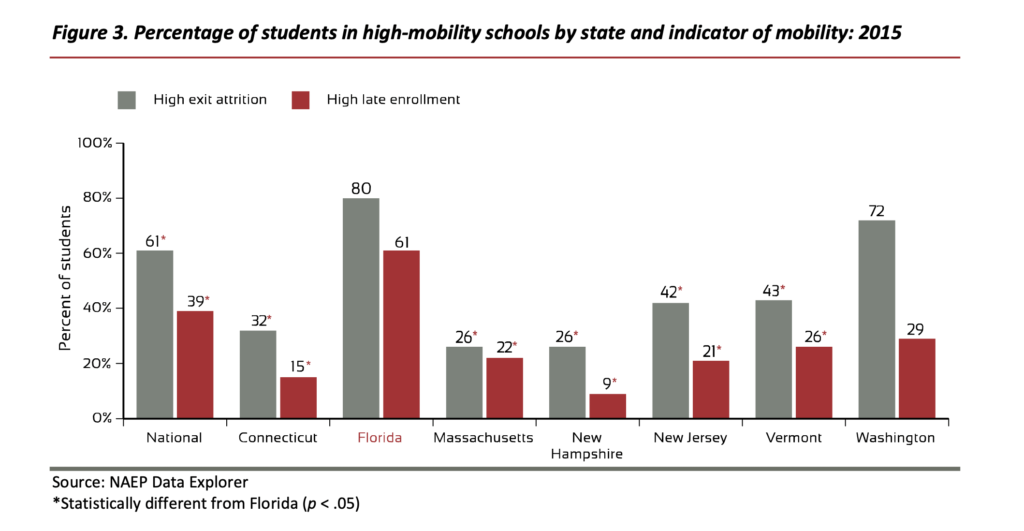
In Florida, 80 percent of students were in schools where 4 percent or more of the student body left before the end of the school year, higher than the national average and the corresponding percentages in Connecticut, Massachusetts, New Hampshire, New Jersey, and Vermont (figure 3; table C.9, appendix C). Similarly, Florida had a larger percentage of students in schools with high rates of late enrollment relative to the same five comparison states. Only Washington had a comparable percentage of students in schools with a high rate of student mobility.
The report recommended that Florida consider further research examining the causes of student absenteeism and mobility in the state. They suggested it might be beneficial to study the role of the agricultural growing season in select areas in relation to exit attrition and late enrollment.
There was NO discussion of the impact of school choice on student mobility.
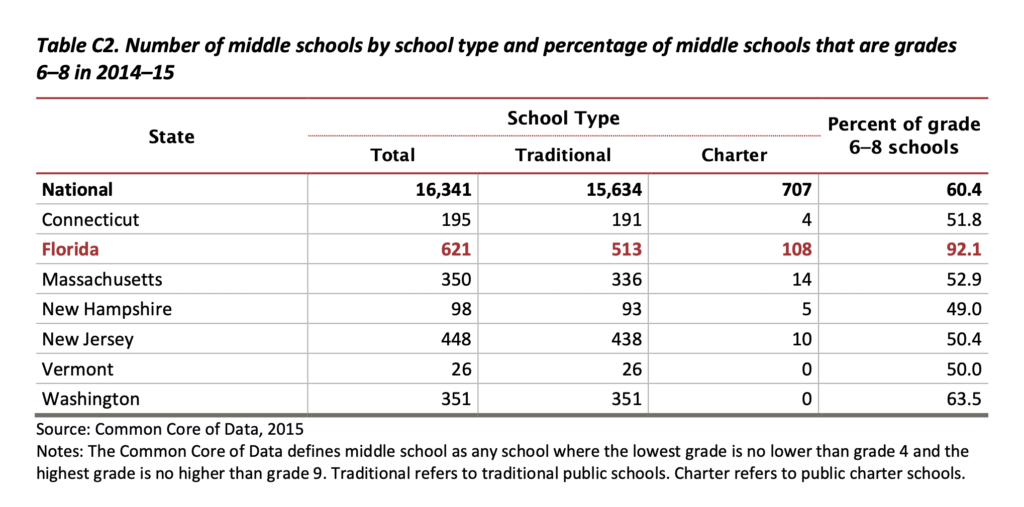
Table C2 did demonstrate that Florida had significantly more charters (and more grade 6-8 middle schools, versus 7/8). At the same time (though not mentioned in the report), none of the comparison states had voucher programs while Florida had several: the Florida Tax Credit Scholarship, the John McKay Scholarship and the Gardiner Scholarship.
The report made some recommendations to mitigate the effect of mobility on academic achievement. They also recommended considering a pilot to encourage families to remain in their middle school by focusing on improving students’ and their families’ sense of membership in the school community and fostering positive relationships between families and school staff.
Of course, in Florida’s School Choice environment, families are encouraged to leave their school if it isn’t a perfect fit for their child. It is hard to imagine Florida creating a pilot program to encourage families to remain in their public school, even if that was shown to improve student outcomes.
In Monroe County, Project 127 was a success – increasing graduate rates from 78% in the 2016-2017 school year to 91% in 2021-22 school year.
The same can not be said for Florida’s 8th grade NAEP scores.
Since the 2017 study, Florida’s 8th graders continue to underperform, regressing from their co-horts’ 4th grade scores, with 8th grade Math scores which continue to be below the national average.
I agree with Billy Townsend’s assessment: “the eighth grade NAEP and “learning rate” failures are evidence that we’ve wasted a generation of human potential and severely damaged Florida’s teaching profession. Will anyone “follow the data” where it leads? Will anyone ask: Should our kids peak at age 9 and decline inexorably from there?”
It is well past time to question ALL of the assumptions of our current education system (Funding adequacy, third grade retention, test and punish accountability, and the incessant roll towards privatization). Our disastrous 8th grade NAEP scores are not a sign of success and ignoring the data does not serve our children or our communities.
“What got you here, won’t get you there.” – Marshall Goldsmith
Guess that third grade retention policy didn’t work out all that well in the end.
As far as the 8th grade math NAEP scores, there has been a push starting last year to move any 7th grade student who scored a 3 or above on the FSA test into Algebra 1 Honors (a very low bar). They are considered 9th grade math students. My school has very few students left in the 8th grade Pre-Algebra classes, and they are generally all low-performing students.
Were the students tested across the board in 8th grade, or only the students taking the 8th grade curriculum?
The NAEP tests kids by grade level, not course enrollment. It also only tests a representative sample of students.