Spin or Substance: Should Florida be Celebrating its Charter School Grades?
On July 11, 2019, the Florida Department of Education (FLDOE) released this year’s school and district grades, reporting “Monumental Improvement in School Grades.” The accompanying press release noted three key highlights:
- The number of “A” schools in Florida continues to rise with 1,172 schools earning an “A” in 2018-19 compared to 1,043 in 2017-18. The percentage of schools earning an “A” increased to 36 percent, up from 31 percent in 2017-18.
- Over half (51 percent) of Florida’s charter schools earned an “A” in 2018-19, compared to 32 percent of traditional public schools.
- Seventy-four percent of charter schools earned an “A” or “B” this year, compared to 61 percent of traditional public schools.
With 2 of the 3 “highlights” focused on charter school success, the FLDOE now appears to be actively promoting charter schools every chance they get. Do they deserve the hype?
Redefined, a school choice advocacy blog funded by Step Up For Students, Florida’s billion dollar non-profit corporation that administers its private school voucher program, was quick to join in on the charter school celebration, repeating the claims that “greater than half” of Florida’s 658 charter schools, serving 313,000 students, earned an A and 74% earned an A or B, compared to 32% of “traditional Public Schools” (serving 2.7 million students) which earned an A and 61% earned an A or B.
Let’s do the math, using their numbers:
“Greater than half” (51%) of Florida’s 313,000 students means just over 159,000 students are attending an A-rated charter school and over 231,000 (74%) are attending an A or B-rated charter school.
In comparison, 864,000 (32% of 2.7 million) students attend an A-rated traditional public school and 1.65 MILLION attend a A or B-rated traditional public school.
Of course, Florida’s most recent annual “Student Achievement in Florida’s Charter Schools” report identified the demographic differences between the two student populations, demonstrating that charters schools, on average, served a lower percentage of at-risk students: fewer English Language Learners, low income students and Students with Disabilities than their public school counterparts. Could this be why they are more likely to achieve A or B school grades?
Still, despite the demographic disadvantages, 2.6 TIMES more students attend A-rated traditional public schools than A-rated charter schools and there are approximately twice as many students attending A/B rated traditional public schools than A/B rated charter schools. Of course, due to the demographic differences, these are apples to oranges comparisons. How do these school compare when controlling for demographics?
A recent report self-published on LinkedIn, by Naples area education consultant Adam Cota, put Florida’s School Grades under a microscope and accounted for differences in demographics, finding less to celebrate regarding this year’s charter school grades, in general.
Cota analyzed 3 years of school grades, achievement data and indicators of at-risk students for Florida’s elementary level schools (only looking at test scores for grades 3-5). He identified schools that were both outperforming and underperforming expected outcomes. We urge you to take a close look at his report. Here are a few of his findings:
- School grades and student achievement were found to tightly correlate with poverty and other indicators of student need. Of course, we have known this for years. 85% of wealthy/low-poverty schools received an “A” compared to only 10% of high-poverty schools.
- When comparing predicted performance (after accounting for risk-factors including poverty, students with disabilities, homelessness and English Language Learners) with a school’s actual performance, 25-40% of “A” and “B” rated schools underperformed expectations. This suggests that a high school grade may give families a false sense of security regarding the actual quality of education provided at many schools.
- Some schools (charter and district-managed) significantly exceeded expectations after accounting for risk-factors. 83% were district managed schools. You can see that list here.
- Cota found Florida’s charter school performance to be inconsistent, with the overall performance celebrated by the FLDOE being significantly influenced by the relative high percentage of charter schools serving “less-needy student population – e.g. 31% of charters have <40% low-income students versus just 15% of district-operated schools.” In other words, charter serve wealthier populations, so their school grades, on average, tend to be higher.
- After accounting for at-risk students, 65% of charter schools were underperforming expectations, though many charter schools (particularly some serving lower income communities ) were over performing, some (like Miami-Dade’s Mater Academy East) impressively so.
A few of his charts/graphs are particularly informative:
Poverty and other factors are highly correlated with student achievement on Florida’s state standardized tests:
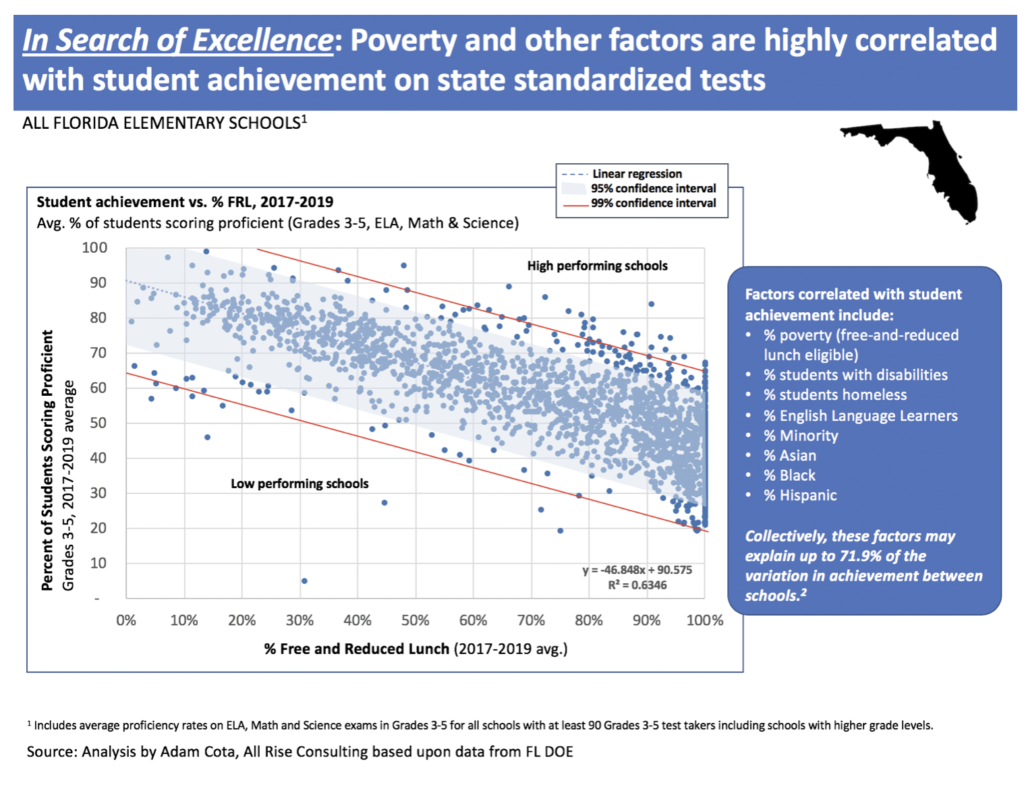
Schools above the 95% and 99% confidence interval were considered to be outperforming and significantly outperforming predictions based on their demographic makeup. Likewise, schools below the 95% and 99% confidence interval were considered to be underperforming and significantly underperforming predictions based on their demographic makeup.
Do “A” and “B” schools outperform?
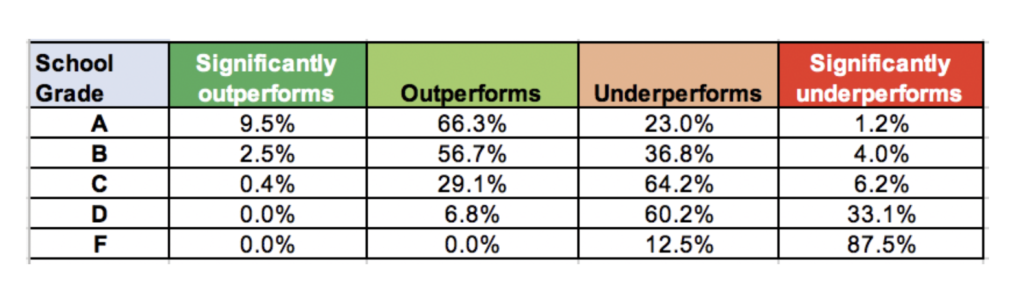
Not always. The good news was that “A” and “B” schools generally outperform 60-75% of the time. The bad news was that means 25-40% of the time, “A” and “B” schools were actually underperforming expectations. Their students did worse than expected. Of the 31 “A” and “B” schools that were underperforming (and some were underperforming by a lot: 20% or more below calculated expectations), 25 were charter schools.
Do Charter Schools Outperform?
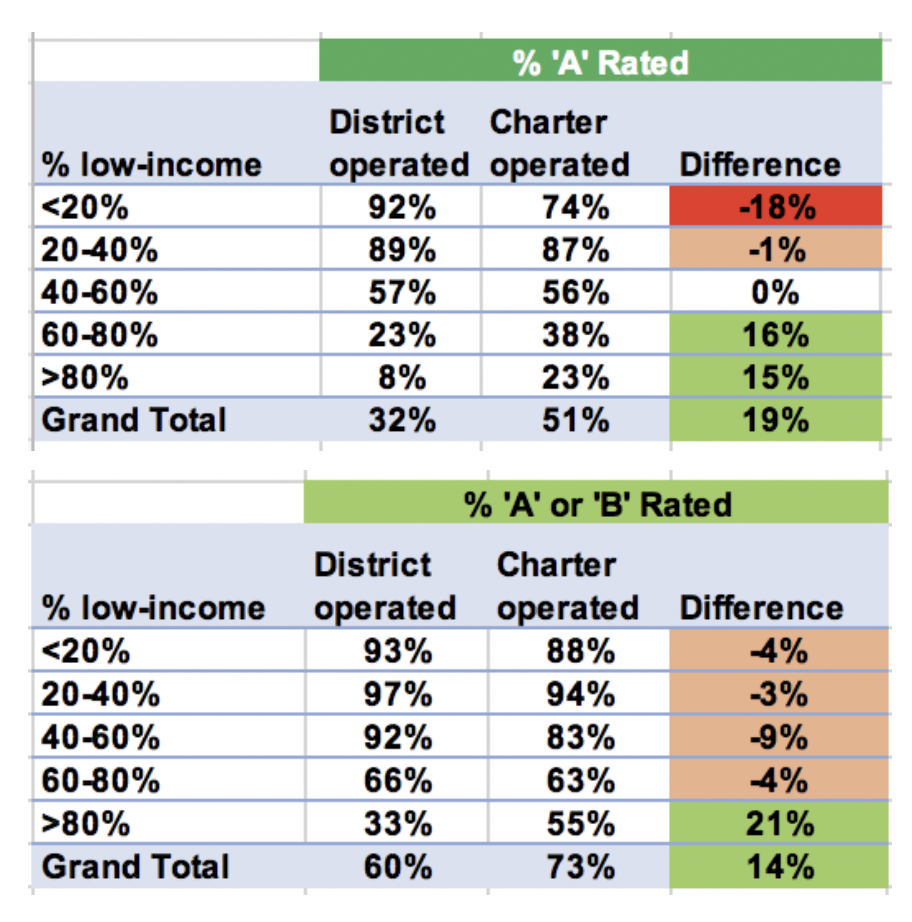
Short answer: no. Controlling for the percentage of low-income students at each school, fewer charter schools earned an “A” or “B” grade at every poverty level except those with >80% low-income students.
If this is true, then what explains the FLDOE’s claims of higher percentages of “A” and “B” rated charter schools? Cota describes it a “mix shift”: twice as many charter schools serve high income students. “Over 30% of charter schools have <40% of students from low-income families versus just 16% for district-operated schools.” Wealthier schools means more “A”s and “B”s.
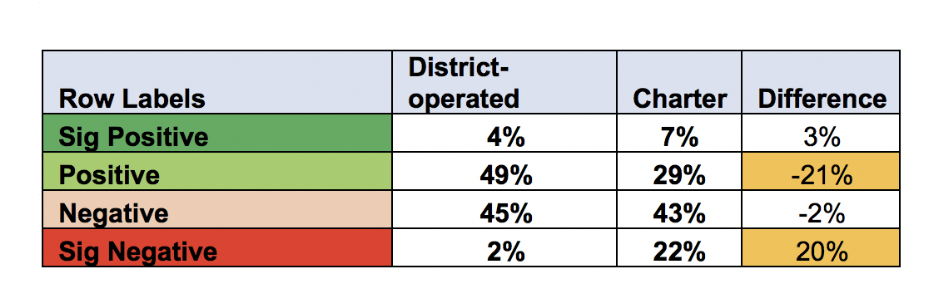
When indicators beyond poverty levels (English Language Learners, Students With Disabilities, etc) were included, nearly 65% of charter schools underperformed expectations. Over 20% significantly underperformed (compared to just 2% of district managed schools). Interestingly, of the 73 charters that significantly underperformed expectations, 21% received an “A” school grade!
In his summary, Cota urges school choice advocates and public school defenders to objectively review his data and work together to identify and replicate the most effective schools, regardless of school type. Noting that, after accounting for student risk factors, 83% of the schools identified as Florida’s Top 100 Elementary Schools were district-operated schools, he recommended developing mechanisms to replicate effective district-operated schools in much the same way effective charters are being replicated..
Finally, he recommended modifying the current School Grade system which he said “currently provides a misleading letter grade(s) which too many interpret as an indication of quality,” suggesting a system that factors in at-risk student populations correlated with student achievement. In other words, Florida should admit that demographics matter.
Thank you, Mr. Cota, for taking a deeper look, beyond the press release, at Florida’s School Grades. We hope Tallahassee will pay attention…
By controlling for demographics, more flaws in the current accountability system are revealed. A high calculated school grade may hide an underperforming school just as a lower school grade may fail to identify a significantly over performing school. Of course, as we’ve said many times, high test scores may, also, reflect excessive test preparation as much as a quality education. Often what we get is accountabaloney:
Any straight A student can tell you their final grade did not always reflect the quality of the course. Likewise, school grades may only reflect the test scores, not the quality of the education provided. In fact, parents of children in “A” schools, or in “A” districts, should be questioning whether their school focuses too much on testing and forgets the whole child. Parents need to start recognizing Florida’s A-F School grade system for what it really is: a reflection of a test focused system that has gone too far.
https://accountabaloney.com/index.php/2016/02/09/what-do-floridas-school-grades-really-tell-you/
ADDENDUM:
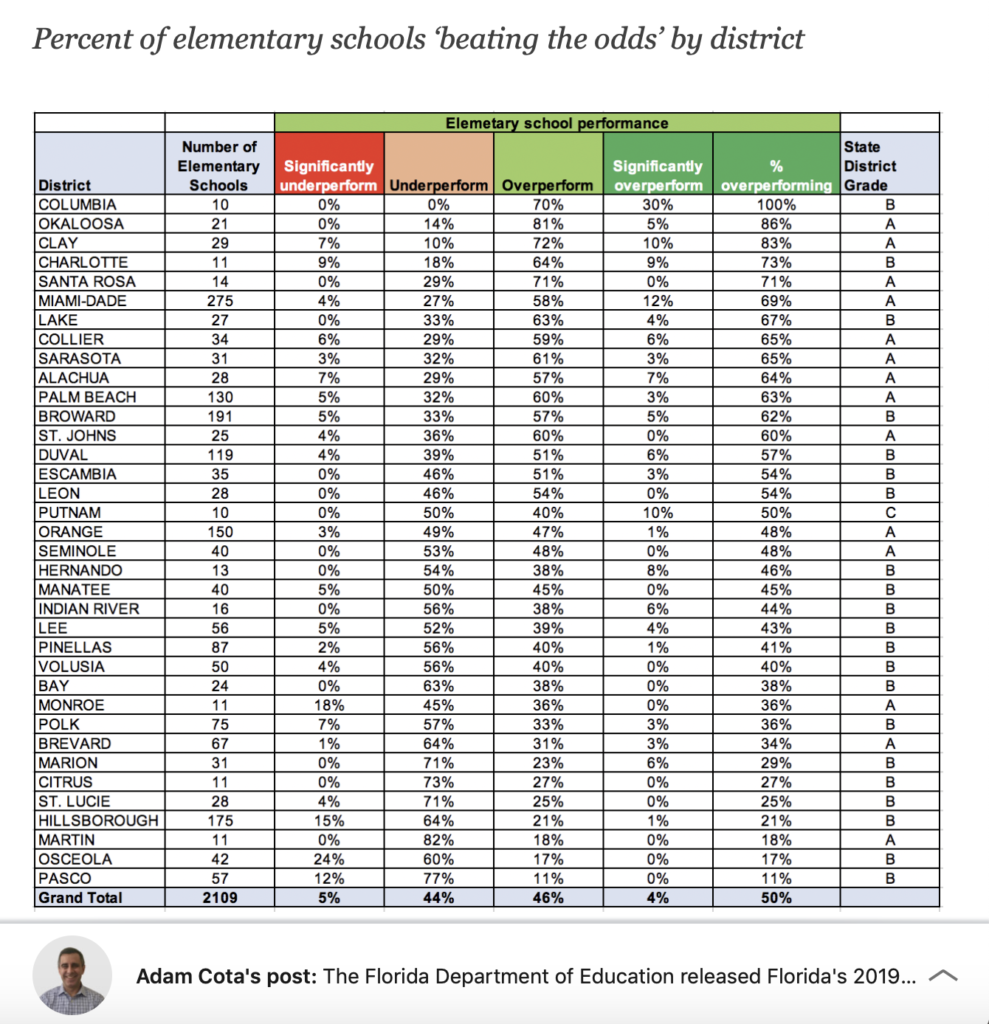
Want to know whether the elementary schools in your district are over or underperforming? The results may surprise you (Congrats to Columbia County with 100% over performing schools!):